
Statistics
Track conversations, message volume, feedback, user engagement, and tool usage to measure adoption and spot content gaps.
Statistics keep a pulse on how your chatbot is used. Watch conversation and message volume, read user feedback, and see which actions get used so you know what to improve next.
Open statistics
From your chatbot dashboard, open the Statistics section in the sidebar.
Choose a view: Chats, Users, or Tools/Actions.
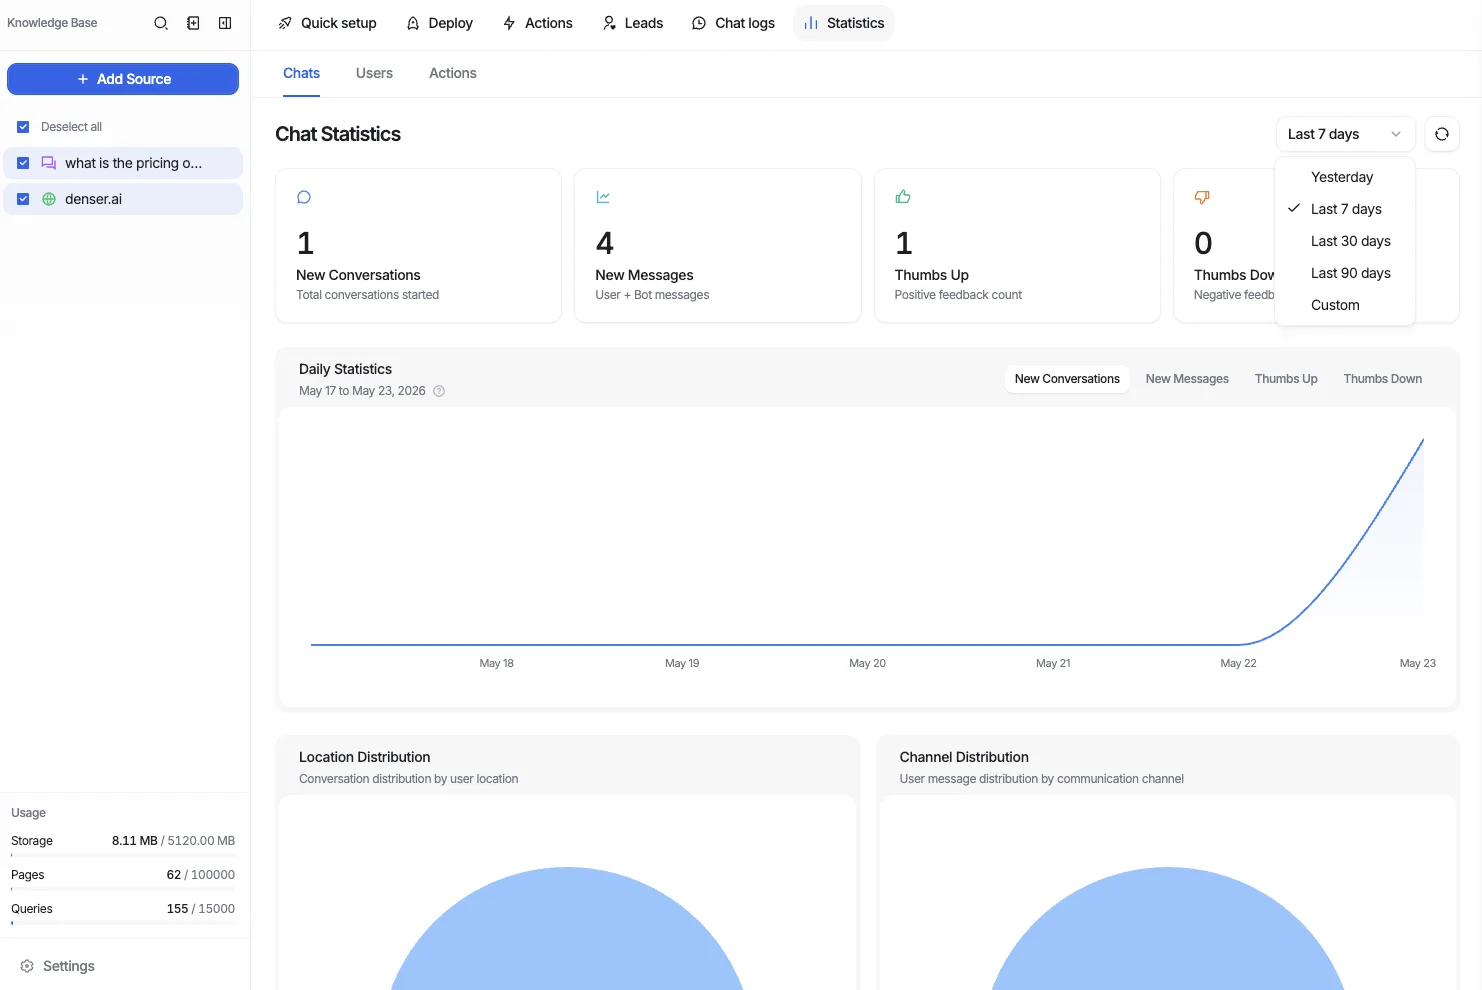
Set the date range — yesterday, 7 days, 30 days, 90 days, or a custom range.
The three views
Chats
How conversations and messages trend over the selected range:
- Conversation count — Number of conversations.
- Message volume — Total messages, split between user and bot.
- Feedback — Thumbs up and thumbs down on bot answers.
Users
Engagement metrics for the people chatting with your bot over the selected range.
Tools / Actions
How often each action runs, so you can see which actions are used most and which go unused.
View the conversations behind feedback
Every thumbs up or thumbs down in the Chats view is tied to a specific conversation. You can jump straight from the chart to that transcript to understand why an answer earned its rating — no scrolling through Chat logs required.
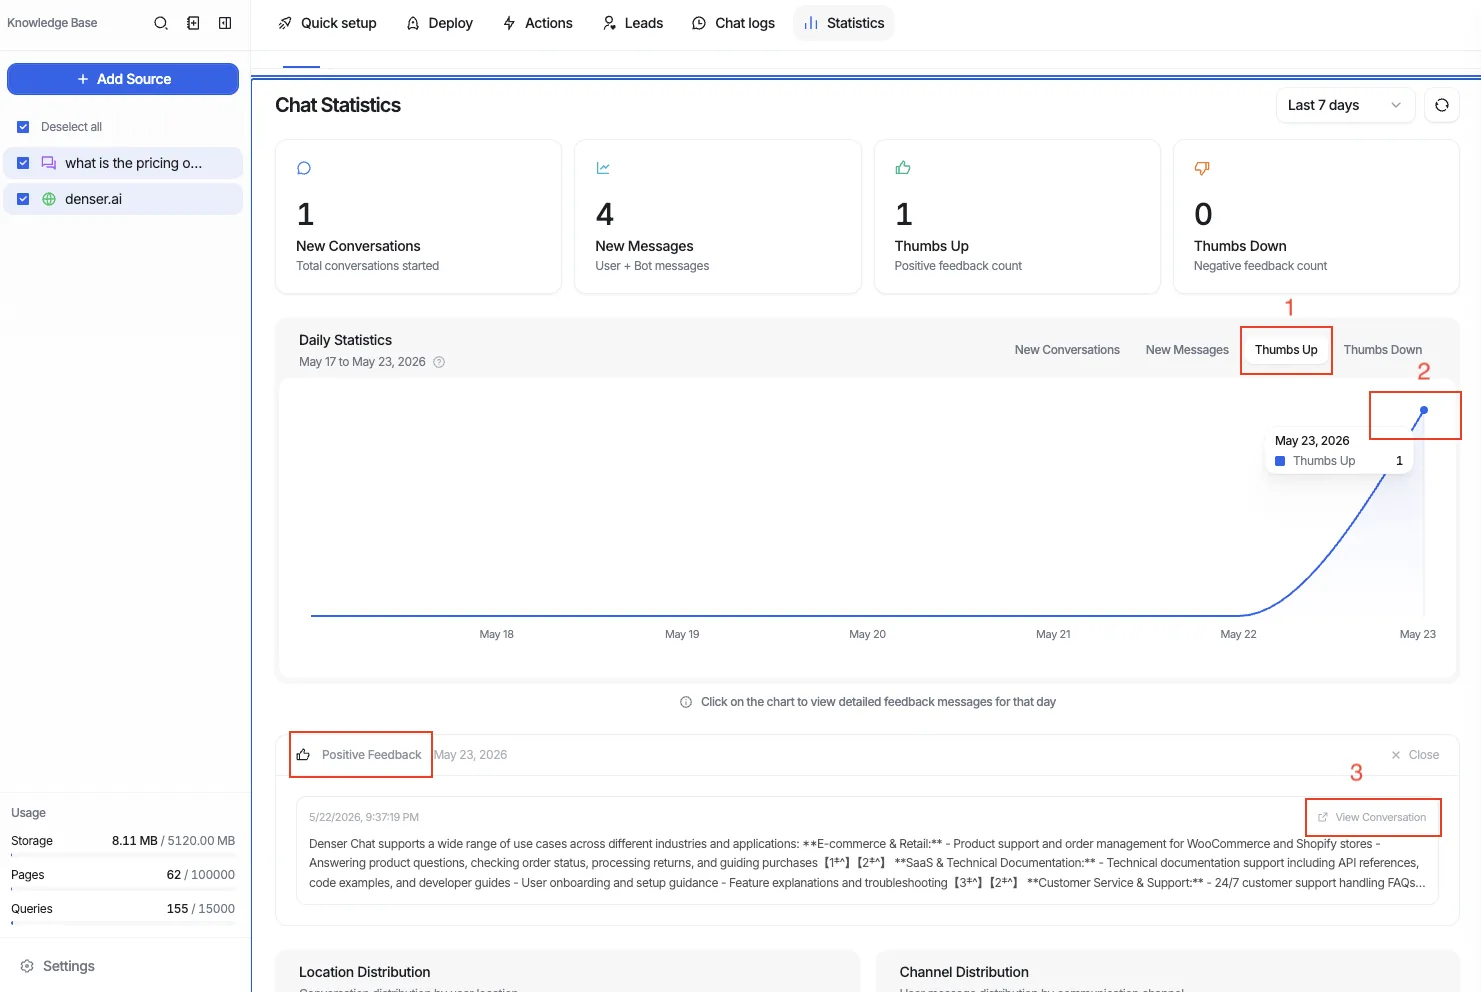
In the Daily Statistics chart, turn on the Thumbs Up or Thumbs Down series with the toggles above the chart.
Click the point for the day you want to inspect. A panel opens below the chart listing that day's feedback — Positive Feedback for thumbs up, Negative Feedback for thumbs down — with the message that received the rating.
Click View Conversation on a feedback entry to open its full transcript.
Read the trends to spot content gaps
The numbers point you to what to fix:
- A rising share of thumbs down means answers are missing or wrong — open Chat logs to find the questions behind them, then add the missing content.
- High message volume with low feedback usually means users keep rephrasing because the first answer fell short.
- An action that never runs may be misconfigured or hard to trigger.
When you find a gap, add a Q&A pair or a new source, then re-check the trend over the next range.
Compare ranges
Switch between 7, 30, and 90 days to tell a one-off spike from a real trend before you act on it.